
Business Dashboard Development
Every product we build comes with its own management dashboard, and we build the same for companies: one place that collects data from your CRM, accounting, payment systems and ad accounts, counts every metric the same way and shows what needs your attention.

When a management dashboard pays off
A dashboard is worth building when decisions wait for numbers, or when the numbers you get depend on who put the report together.
- Every Monday someone spends hours exporting data from the CRM, accounting and ad accounts into one spreadsheet, and the report is already out of date when you open it
- Sales, finance and marketing each report a different revenue figure for the same month, and meetings start with arguing about whose number is right
- You find out about a drop in orders, an unpaid invoice or an empty warehouse shelf when a customer or accountant tells you, not when it happens
- Ad spend is visible in the ad accounts and sales are visible in the CRM, but nobody can say which campaigns actually bring paying customers
- The company has grown past the point where the owner can keep all the numbers in their head or in one Google Sheet
- You already pay for a BI tool, but the dashboards in it are half-finished, slow or trusted by nobody
What goes into the dashboard
Sales and revenue
Pipeline, deals won and lost, revenue by product, region and manager, average order value and repeat purchases. Plans against actuals, so you see the gap during the month and not after it.
Finance and cash
Income and expenses by category, margin, receivables and payables, and the cash position from bank and payment system data. Overdue invoices are listed by client, with amounts and days late.
Marketing and acquisition
Spend from Google, Meta and other ad accounts joined with leads and paid orders from the CRM. You see cost per lead and cost per paying customer by channel, not only clicks and impressions.
Operations and team
Order processing times, delivery status, support tickets, project workload and tasks that are stuck. The metrics come from the systems your team already works in, so nobody fills in extra forms.
Stock and supply
Stock levels by warehouse and product, turnover, items running low and items that have not moved for months. Useful for retail, e-commerce and distribution, where frozen stock is frozen money.
Alerts and scheduled digests
Notifications by email or Telegram when a metric leaves its normal range: sales fall below plan, a payment fails, stock runs out. A short digest arrives on schedule, so you do not have to open the dashboard to know things are fine.
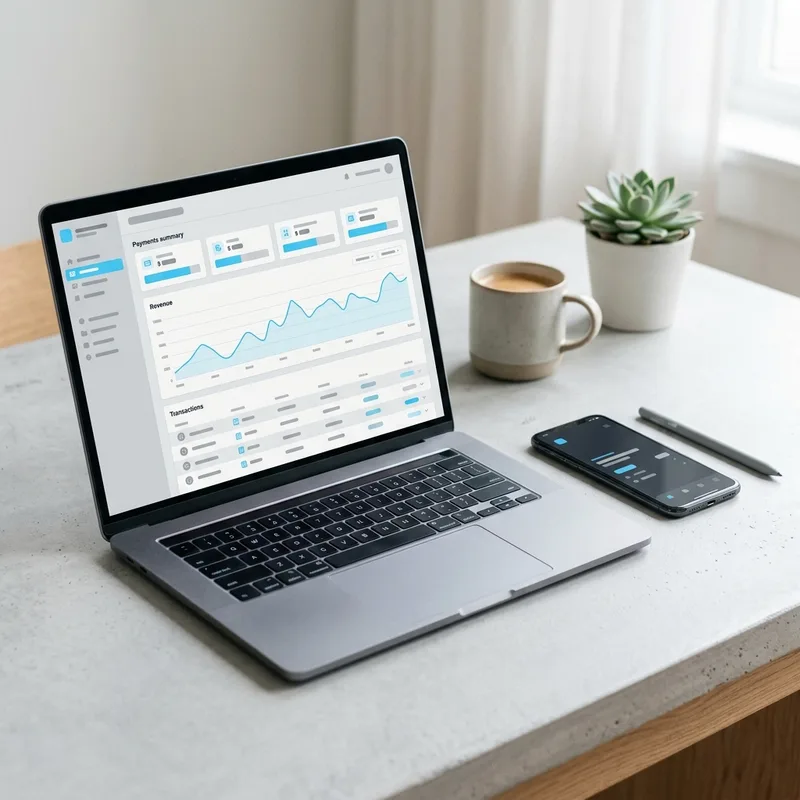
Built into every product we make
We build a management dashboard into the admin panel of every product we develop. Abuk, MemoWord, ELCARO, Meest China and Octolab each have one. It collects payments from app stores and marketplaces, payment systems, 1C, the product’s own database and the connected services and tools that can share their data, and shows the owner the whole business in one place. We use the same approach for companies without their own app: we connect the systems you already work in.
- Payments from the App Store, Google Play and marketplaces
- Payment systems and banks
- 1C and other accounting systems
- The product's internal database
- Connected services and tools with an API or data export
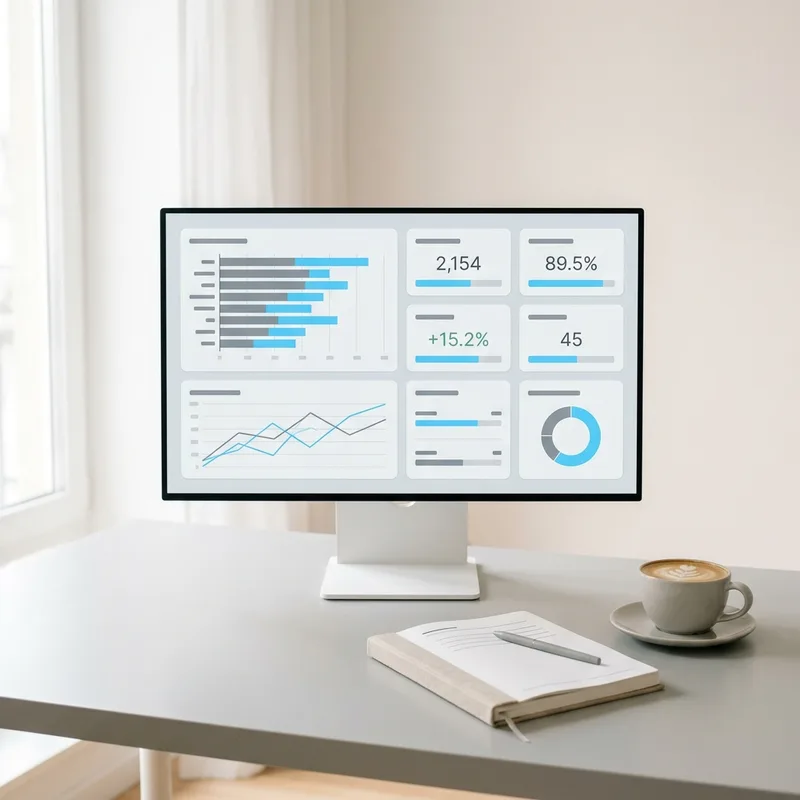
One source of truth: data from every system, one definition per metric
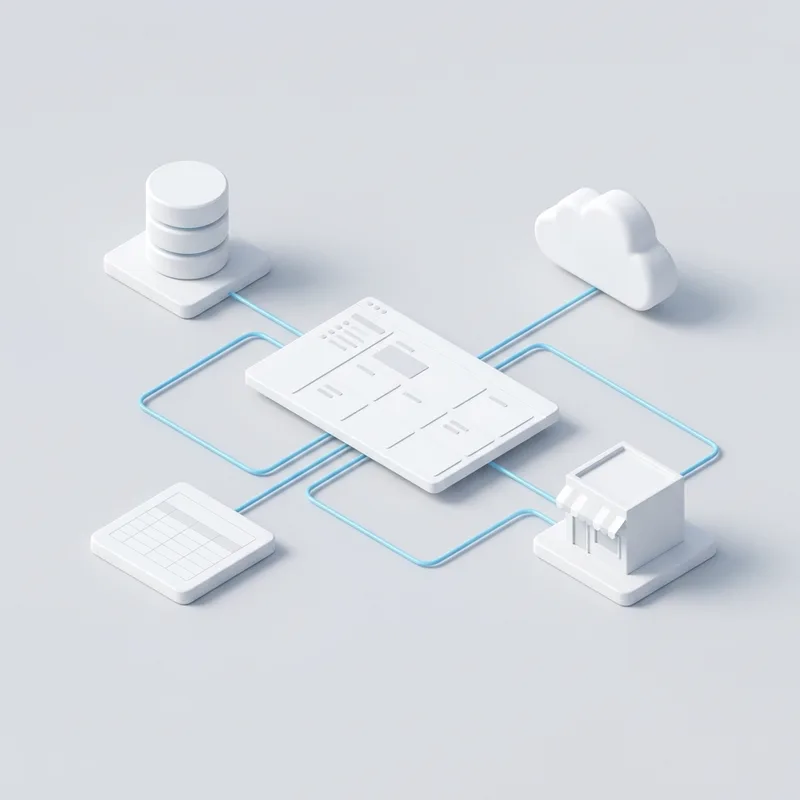
Most management reporting problems are not about charts. They come from data scattered across a CRM, an accounting system, payment providers, ad accounts, Google Sheets and your own database, and from the fact that nobody has written down what counts as revenue, as a new client or as an active order. Before we build anything we agree these definitions with you and the heads of departments: whether revenue is counted on invoice or on payment, with or without VAT and refunds, how a returning client differs from a new one. Then we connect the sources through their APIs, exports or direct database access, clean and match the data, and load it on a schedule. When a number on the dashboard looks wrong, you can trace it back to the records it came from.
- A written metric glossary: each metric, its formula, its source and its owner
- Connections to CRM, ERP and accounting, payment systems, ad accounts, Google Sheets and your own databases
- Automatic updates on a schedule that fits each source, from every few minutes to once a day
- Checks that flag missing or suspicious data before it reaches the dashboard
- Drill-down from any total to the underlying deals, invoices or orders
Ready-made BI tool or custom development: how we choose
For many companies a ready-made BI tool is the right answer. Looker Studio is free and works well with Google Sheets, Google Ads and GA4. Metabase is open source, can run on your own server and lets managers build simple questions themselves. Power BI fits companies already on Microsoft 365 and gives strong modelling for finance. A custom dashboard makes sense when the dashboard has to live inside your own product or admin panel, when clients or partners need to see their own data, when access rules are complex, or when per-user licences for a large team would cost more than building. We compare the options on your sources, users and budget, and often combine them: a BI tool for internal analysis, a custom view where it is part of your service.
- A recommendation per case, with the reasons written down
- Looker Studio, Metabase or Power BI set up properly, not left as a demo
- Custom dashboards built into your web application or admin panel
- A data layer that stays the same if you change the visual tool later

Data storage, access and mobile view without extra complexity
Not every company needs a data warehouse. If you have three sources and modest volumes, a BI tool connected directly, or a single reporting database, is enough. A separate warehouse such as PostgreSQL, BigQuery or ClickHouse becomes worth it when there are many sources, a lot of history, or when live queries start slowing down your production systems. We choose the simplest setup that will still work in two years. Access is set by role: the owner sees everything, a sales manager sees their own pipeline, a warehouse lead sees stock, and each view works on a phone as well as on a large screen. As an option, we add AI on top: a written summary of the week and the possibility to ask questions about the data in plain language, with answers based only on your metrics.
- A storage setup sized to your data, from a single reporting database to a warehouse
- Role-based access, down to the level of region, department or client
- Layouts that work on a phone for owners who check numbers on the move
- Optional AI summaries and plain-language questions about your data
How we build a dashboard
Decisions first
We talk to the owner and department heads about which decisions they make every week and month and which numbers they wait for. You get a short list of questions the dashboard must answer.
Metrics and definitions
For each question we define the metric, the formula and the target or normal range. You approve a metric glossary that ends disputes about whose figure is right.
Data sources audit
We check where each metric comes from, how clean the data is and how it can be accessed. You get a data map and an honest note on gaps, such as fields your team does not fill in.
Prototype
A working first version on your real data, usually with a few key screens. You and your managers use it for a while and tell us what is missing or unclear.
Launch
We complete the screens, set up automatic updates, roles, alerts and the mobile view, and check the figures against your accounting. Your team gets access and a short guide.
Support and changes
We fix broken connections when a source system changes, add metrics as the business grows and keep the definitions up to date. You get a dashboard that is still trusted a year later.
Tools and technologies
BI and visualisation
- Looker Studio
- Metabase
- Power BI
- Custom dashboards in Vue.js
Data storage and processing
- PostgreSQL
- MySQL
- BigQuery or ClickHouse where volumes require it
- Python
- PHP / Laravel
Data sources
- App Store, Google Play and marketplaces
- 1C and other accounting systems
- CRM and ERP systems
- Payment systems and banks
- Google Ads, Meta Ads, GA4
- Google Sheets and your own databases
Delivery and alerts
- n8n, Make, Zapier
- REST APIs and webhooks
- Email and Telegram notifications
- LLM-based summaries (optional)
How we can work together
Fixed scope
A defined set of metrics, sources and screens with an agreed result. Suits a first management dashboard or a rebuild of one that nobody trusts.
Dedicated team
A team that extends reporting department by department, maintains the data pipelines and adds new sources as you adopt new systems.
Hourly
Audits of existing dashboards, fixes to broken reports, new metrics and ongoing support. You pay for the time actually spent.
Related projects
See also: Process automation · AI integration · Web development · Server support
Reviews
We treat each client and his project with love.

Revol team continues to streamline the client’s development capabilities through their high-quality work and reliable support. They communicate effectively and exhibit a strong understanding of the client’s needs and business.
Tomas


The work from Revol, have fully met expectations and satisfied the client. Their fresh approach and ability to remain available for support have been valuable assets. Customers can bring them on for a communicative, client-oriented team to achieve their goals with.
Andrey
Frequently asked questions
Have you built dashboards like this before?
Yes, it is part of every product we develop. Abuk, MemoWord, ELCARO, Meest China and Octolab each have a management dashboard in their admin panel that brings together payments from app stores and marketplaces, payment systems, 1C, the internal database and connected services. For your company we build the same kind of dashboard on top of the systems you already use.
Should we use Looker Studio, Metabase, Power BI or a custom dashboard?
It depends on your data sources, the number of users, how complex the access rules are and whether the dashboard is for your team or part of your product. Looker Studio suits Google-centred companies, Metabase suits those who want self-hosting and simple self-service, Power BI suits Microsoft-based finance teams. Custom development makes sense for dashboards inside your own product, client-facing views or complex permissions. We recommend after looking at your case, not before.
Our systems have no ready connector to the BI tool. Is that a problem?
Usually not. If a system has an API, we pull data through it; if it only exports files or has a database, we work with those. The data is collected into a reporting database, and the BI tool reads from there. We will tell you if a source is unreliable and what that means for the figures.
Do we need a data warehouse?
Not always. With a few sources and moderate volumes, a single reporting database or a direct connection is enough and cheaper to run. A warehouse becomes worth it when there are many sources, years of history or heavy queries that slow down your working systems. We start simple and leave room to grow.
Why do our departments report different numbers, and how does a dashboard fix that?
Usually because each department counts differently: revenue on invoice or on payment, with or without refunds, a client as a company or as a contact. The dashboard fixes it only if the definitions are agreed first. That is why we write a metric glossary with you before building, and the dashboard then calculates every figure one way.
How often is the data updated?
As often as the sources and the decisions require. Sales and payments can be refreshed every few minutes or hourly, accounting data often daily, ad spend several times a day. We agree the schedule per source and show the time of the last update on each screen, so nobody mistakes old data for current.
Can managers see only their own data?
Yes. Access is set by role and, where needed, by region, department, manager or client. The owner sees the whole company, a sales manager sees their own pipeline, a partner or client sees only their account if the dashboard is shared outside the company.
Can we ask the dashboard questions in plain language?
As an option, yes. We can add an AI layer that writes a short summary of the week and answers questions such as which region fell below plan and why, using only your agreed metrics. It works best on top of a clean data model, so we usually add it after the dashboard itself is stable. More detail is on our AI integration page.
Tell us about your project
Describe the task in a few lines. Within one working day we reply with questions or a first view on scope and cost.
Prefer email or a call?
welcome@revolsource.com
+38 097 662 23 20
Revol Software OÜ, Tallinn, Estonia. Our team is distributed around the world.
Join our team
Send your CV to career@revolsource.com